
# TODO
□ 요청자, 처리자간의 통계 / 불균형(누가 처리에 문제가 있는지 확인) VIEW 추가
□ multi pages
□ streamlit chart
□ Deploy
□ docker
1. 요청자, 처리자간의 통계 / 불균형(누가 처리에 문제가 있는지 확인) VIEW 추가
이미지 판별기 테스트하면서 수집했던 AWS 서버의 DB에 쌓인 데이터를 활용한다.
import streamlit as st
import pandas as pd
import matplotlib.pyplot as plt
import requests
st.title('요청/ 처리 건수 (h)')
def load_data():
url = 'http://43.202.66.118:8077/all'
r = requests.get(url)
d = r.json()
return d
data = load_data()
df = pd.DataFrame(data)
#df
#TODO
#request_time, prediction_time 이용해 '%Y-%m-%d-%H' 형식
#즉 시간별 GROUPBY COUNT 하여 plt 차트 그려보기
df
df['request_time'] = pd.to_datetime(df['request_time'])
df['request_time'] = df['request_time'].dt.strftime('%Y-%m-%d-%H')
df_time = df.groupby('request_time').size().reset_index(name='count')
df_time
# 데이터 로드 및 변환
df['request_time'] = pd.to_datetime(df['request_time'])
df['request_time'] = df['request_time'].dt.strftime('%Y-%m-%d-%H')
# 그래프 그리기1d
fig, ax = plt.subplots(figsize=(10,6))
df_time.plot(kind='bar', x='request_time', y='count', ax=ax)
plt.plot(df_time.index, df_time['count'], 'ro-')
ax.set_title('Requests by Date and Time')
ax.set_xlabel('Date and Time')
ax.set_ylabel('Number of Requests')
plt.xticks(rotation=45)
plt.tight_layout()
# Streamlit을 통해 차트 표시
st.pyplot(fig)
# 요청자, 처리자 통계
df['prediction_time'] = pd.to_datetime(df['prediction_time'])
df['prediction_time'] = df['prediction_time'].dt.strftime('%Y-%m-%d-%H')
#def time_check():
df_diff = df[df['prediction_time'] != df['request_time']]
df_diff = df_diff.groupby('request_user').size().reset_index(name='count')
df_diff
# 그래프 그리기1d
fig, ax = plt.subplots(figsize=(10,6))
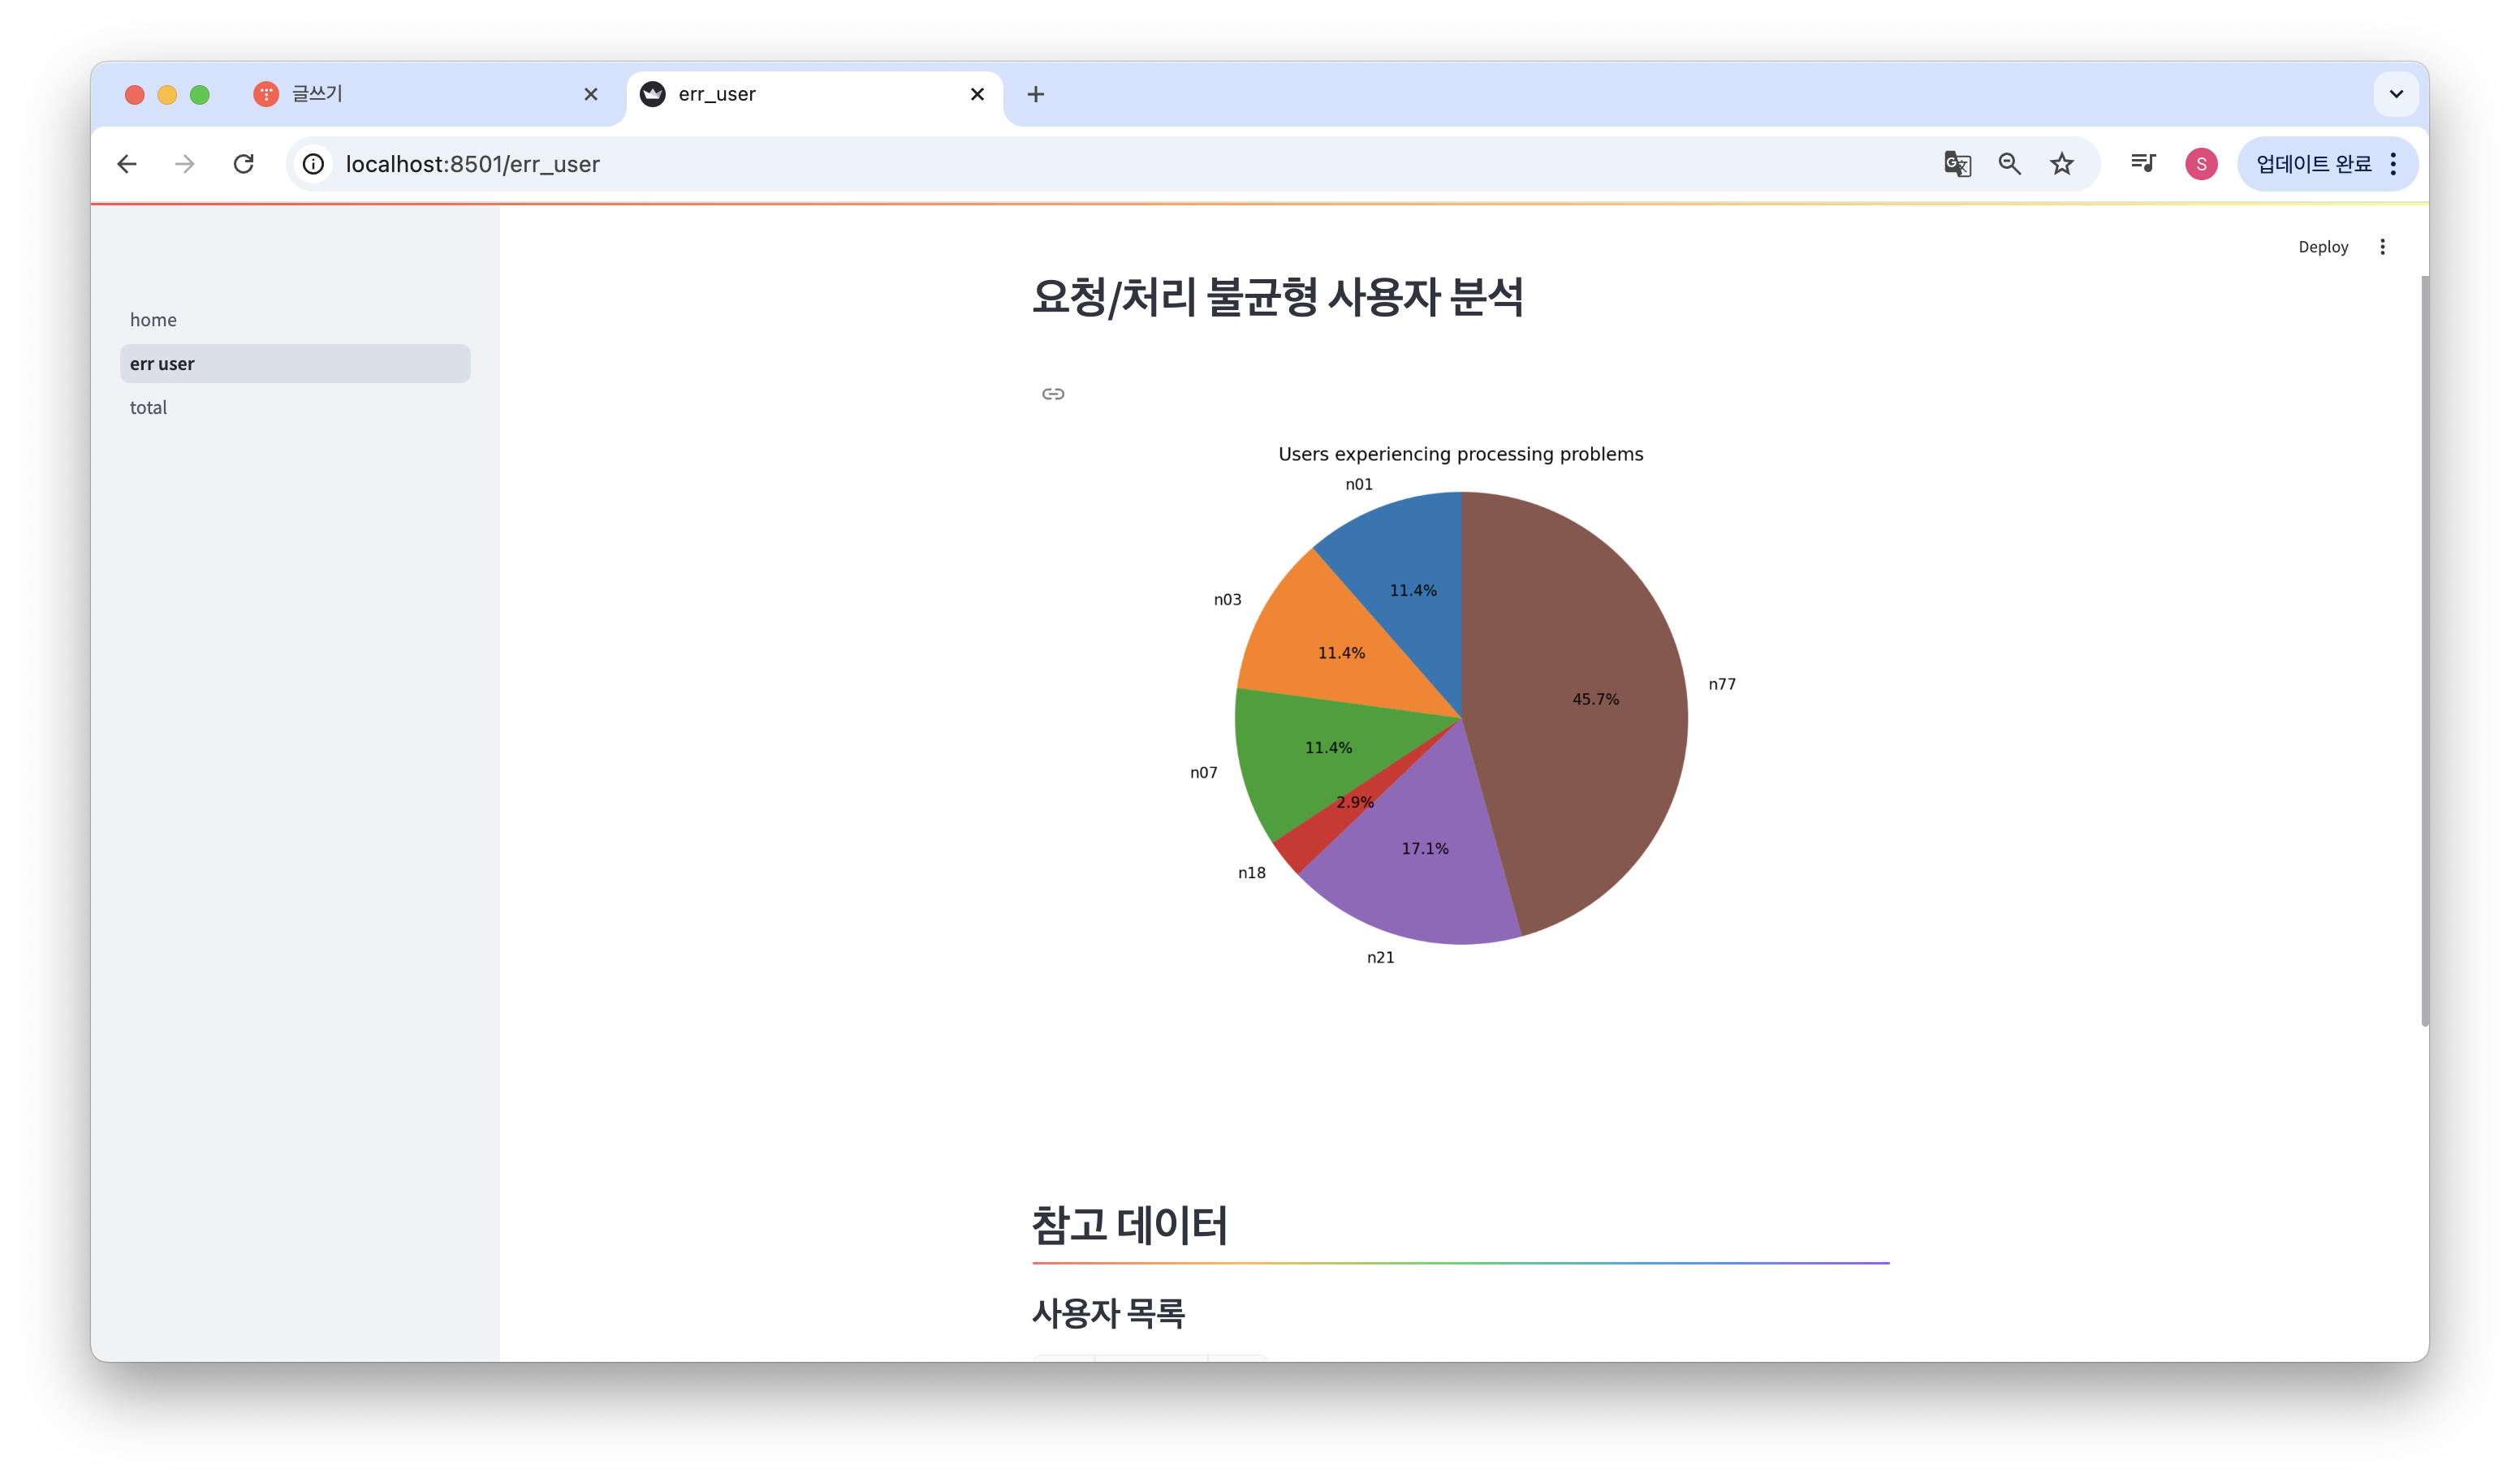
ax.pie(df_diff['count'], labels=df_diff['request_user'], autopct='%1.1f%%', startangle=90)
ax.set_title('Users experiencing processing problems')
# Streamlit을 통해 차트 표시
st.pyplot(fig)스트림릿이 좋은 점이 데이터프레임 정의해서 df 하면 바로 화면에 출력된다.
이런식으로 vv

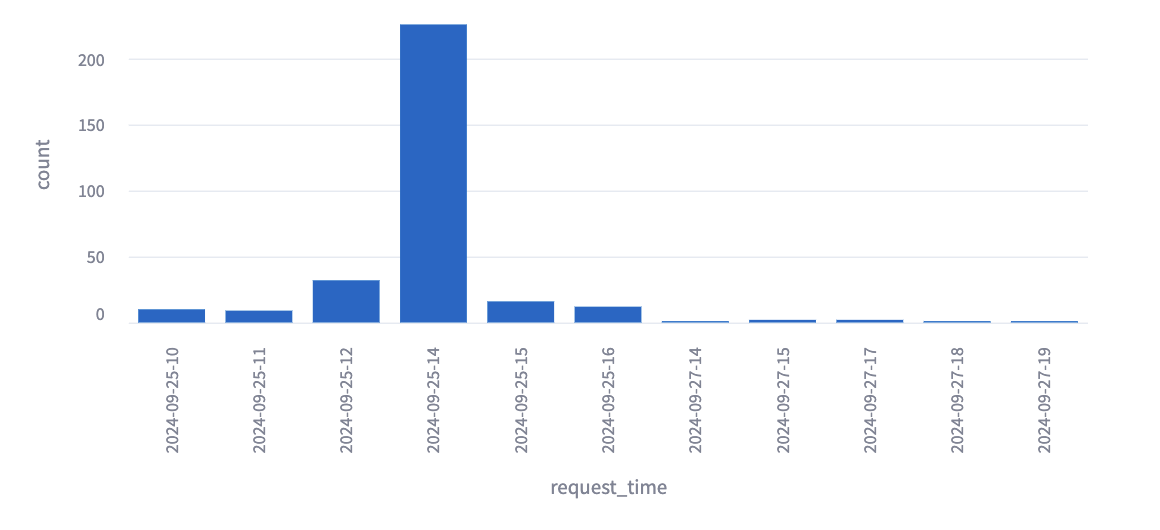
간단하게 코드 설명을 하면 첫 번째 그래프는 데이터 중 request_time 데이터를 "년월일시간" 으로 추출하여 시간 별 데이터 개수를 나타내는 코드이다. plot 함수를 사용하여 그래프를 그렸다.
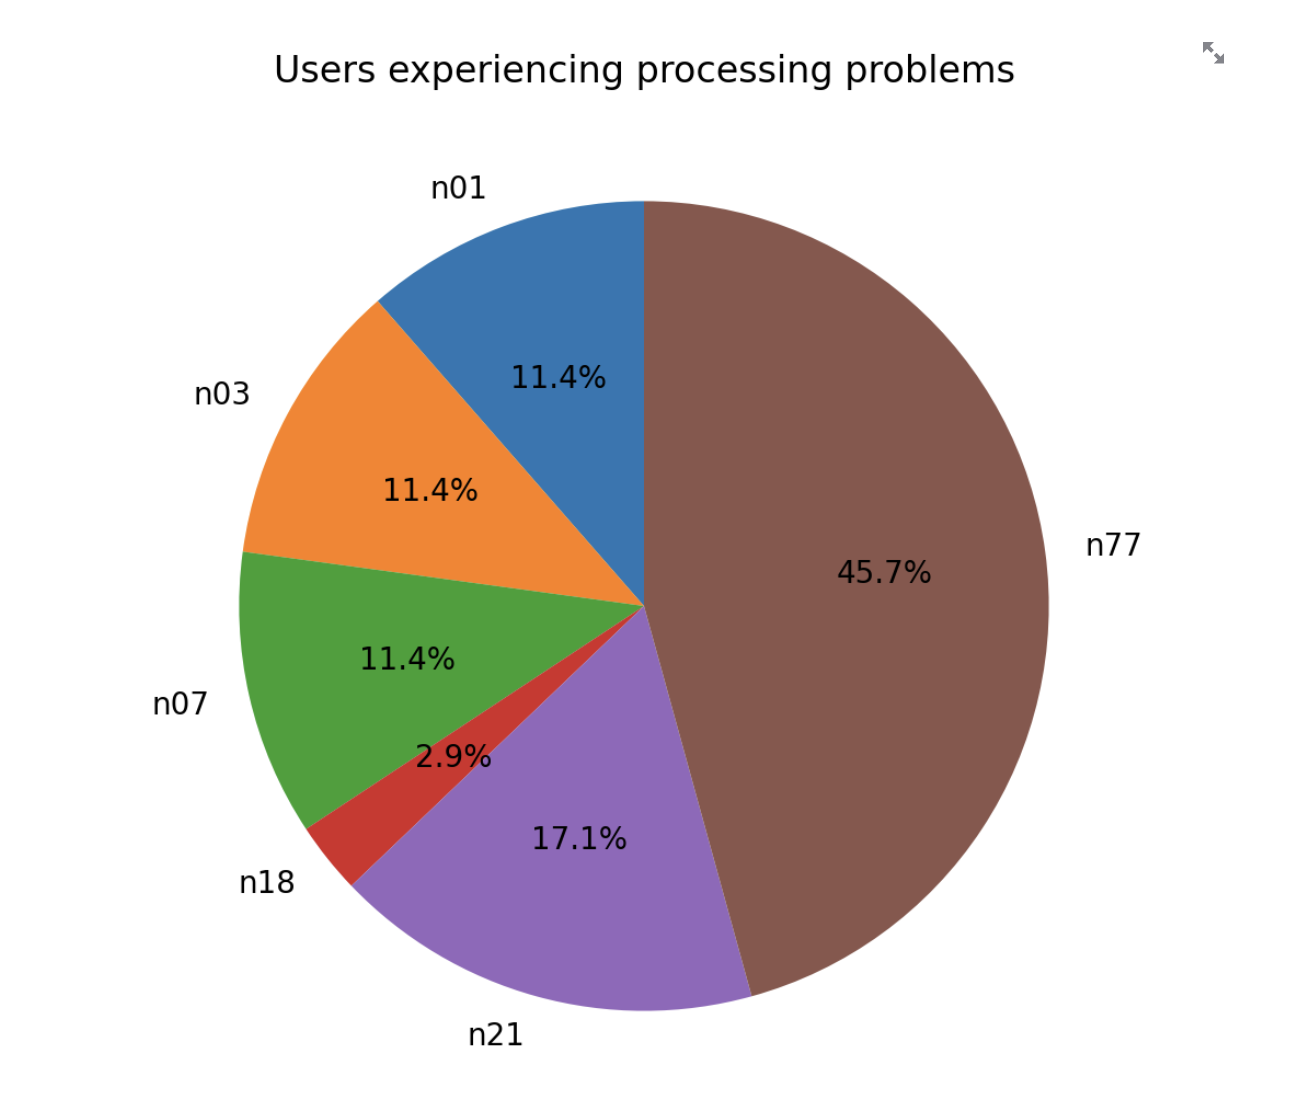
두 번째 그래프는 요청자, 처리자 간의 통계, 불균형 이 부분을 위한 코드이다. 데이터프레임에 request_time과 prediction_time 열이 존재한다. 먼저 prediction_time도 마찬가지로 "년월일시간" 형태로 변환해준다.
우리는 3분 크론탭을 사용해서 예측을 했기 때문에 (나는 1분으로 하긴 했음) 보통의 경우에서는 두 데이터에는 차이가 나지 않아야 한다. (예외도 있긴하다 59분 -> (3분 후) -> 시간 +1 , 근데 이건 일단 무시하기) 그래서 두 데이터가 다른 경우만 뽑아서 사용자 별 개수를 알 수 있도록 하고 원 그래프를 통해 그 비율을 볼 수 있도록 했다.
아래의 코드를 실행시키면 각종 데이터프레임과 아래의 두 그래프를 포함한 스트림릿 앱?이 실행된다.
$ streamlit run src/stdash/app.py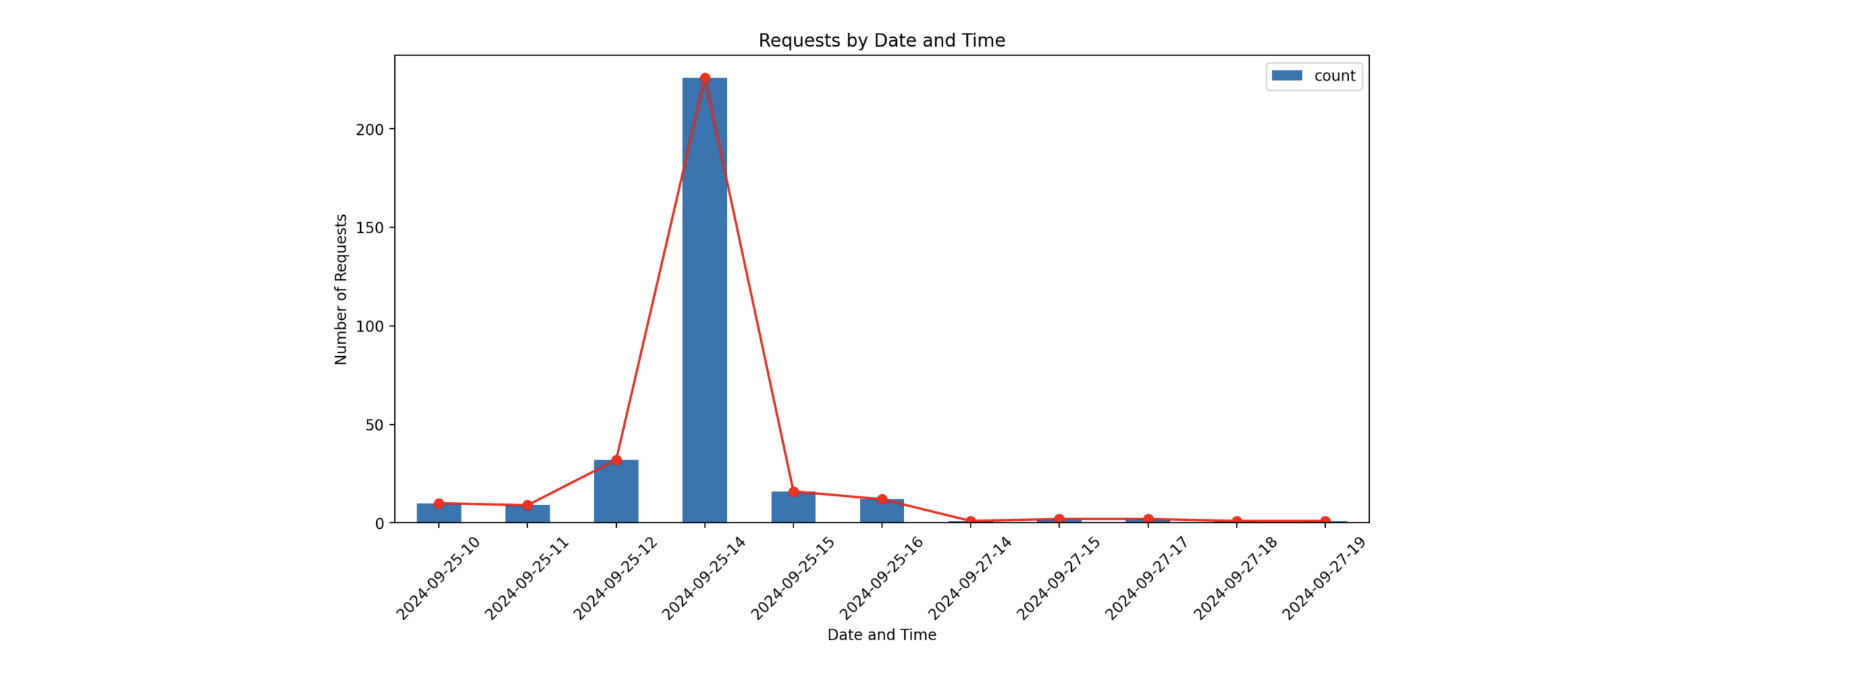
2. multi pages
https://docs.streamlit.io/get-started/fundamentals/additional-features
Streamlit Docs
Join the community Streamlit is more than just a way to make data apps, it's also a community of creators that share their apps and ideas and help each other make their work better. Please come join us on the community forum. We love to hear your questions
docs.streamlit.io
이 단계는 멀티 페이지를 만드는 단계이다. 페이지 전환이 가능하도록 하는 것 이다. 위에서 만든 두 개의 그래프를 각각의 페이지에 표시할 . 것 이다. 공식문서를 참조하여 만들었다.
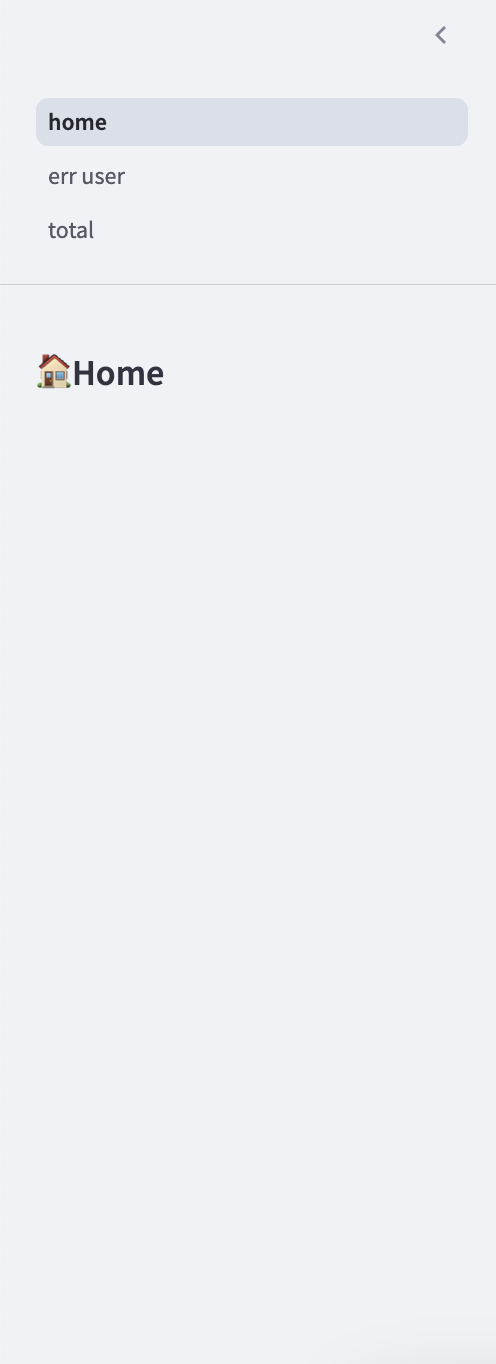
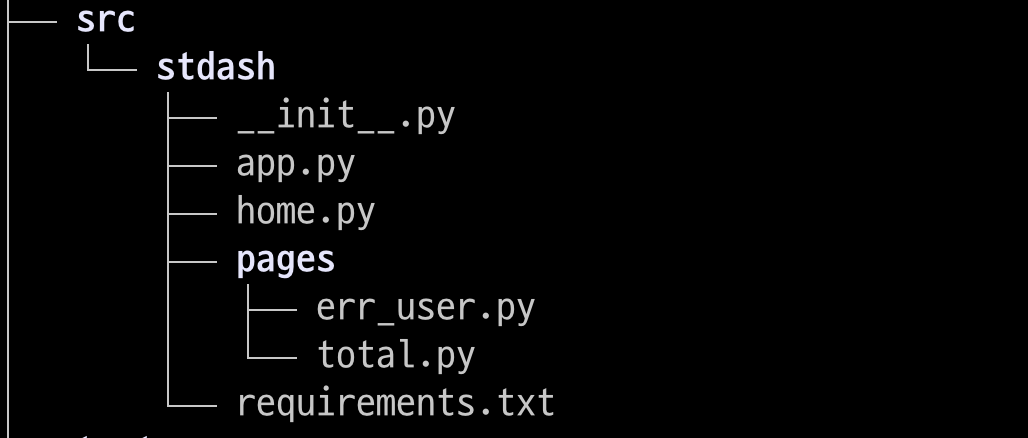
멀티 페이지를 위해서 디렉토리가 아래와 같이 구성되어야 한다. 첫 번째 페이지가 home.py 이고, 멀티 페이지로 구성될 부분은 pages아래 py 파일로 작성되어야 한다.
나는 home.py에서 타이틀 작성과 데이터 로드를 수행했다.
import streamlit as st
import pandas as pd
import requests

st.markdown("# 🖼️ 이미지 처리 프로그램 결과 요약")
st.sidebar.markdown("# 🏠Home")

def load_data():
    url = 'http://43.202.66.118:8077/all'
    r = requests.get(url)
    d = r.json()
    df = pd.DataFrame(d)
    return df
그리고 하위페이지에서 함수를 임포트하여 사용할 수 있게 했다.
from home import load_data
pages/total.py
import streamlit as st
import pandas as pd
import requests
from home import load_data
import matplotlib.pyplot as plt

st.header("요청 / 처리 건수(h)")

df = load_data()


df['request_time'] = pd.to_datetime(df['request_time'])
df['request_time'] = df['request_time'].dt.strftime('%Y-%m-%d-%H')

df_time = df.groupby('request_time').size().reset_index(name='count')


# 그래프 그리기1d
fig, ax = plt.subplots(figsize=(10,6))
df_time.plot(kind='bar', x='request_time', y='count', ax=ax)
plt.plot(df_time.index, df_time['count'], 'ro-')
ax.set_title('Requests by Date and Time')
ax.set_xlabel('Date and Time')
ax.set_ylabel('Number of Requests')
plt.xticks(rotation=45)
plt.tight_layout()

# Streamlit을 통해 차트 표시
st.pyplot(fig)

st.header('')
st.header('')
st.header('참고 데이터',divider='rainbow')
st.subheader("데이터")
df
st.subheader("시간 별 데이터")
df_time%


3. streamlit chart
plot을 사용해서 그래프를 그렸는데, 스트림릿에서 그래프를 그리는 기능을 제공한다고 한다.
https://docs.streamlit.io/develop/api-reference/charts
Streamlit Docs
Join the community Streamlit is more than just a way to make data apps, it's also a community of creators that share their apps and ideas and help each other make their work better. Please come join us on the community forum. We love to hear your questions
docs.streamlit.io
막대그래프를 plot 대신 streamlit chart를 이용해서 그려보았다.
아쉽게도 글자를 회전하는 기능을 제공하지 않아서 날짜 문자열이 옆으로 누웠다.
이 부분이 마음에 들지 않아서 나는 그냥 plot을 계속 사용하기로 했다.
st.bar_chart(
    df_time,
    x='request_time',
    y='count'
)
4. Deploy
https://docs.streamlit.io/deploy/streamlit-community-cloud/get-started/quickstart
Streamlit Docs
Join the community Streamlit is more than just a way to make data apps, it's also a community of creators that share their apps and ideas and help each other make their work better. Please come join us on the community forum. We love to hear your questions
docs.streamlit.io
지금까지 만든 부분을 스트림릿 앱으로 배포해보자. 여기들어가서 로그인 먼저
https://share.streamlit.io/
share.streamlit.io
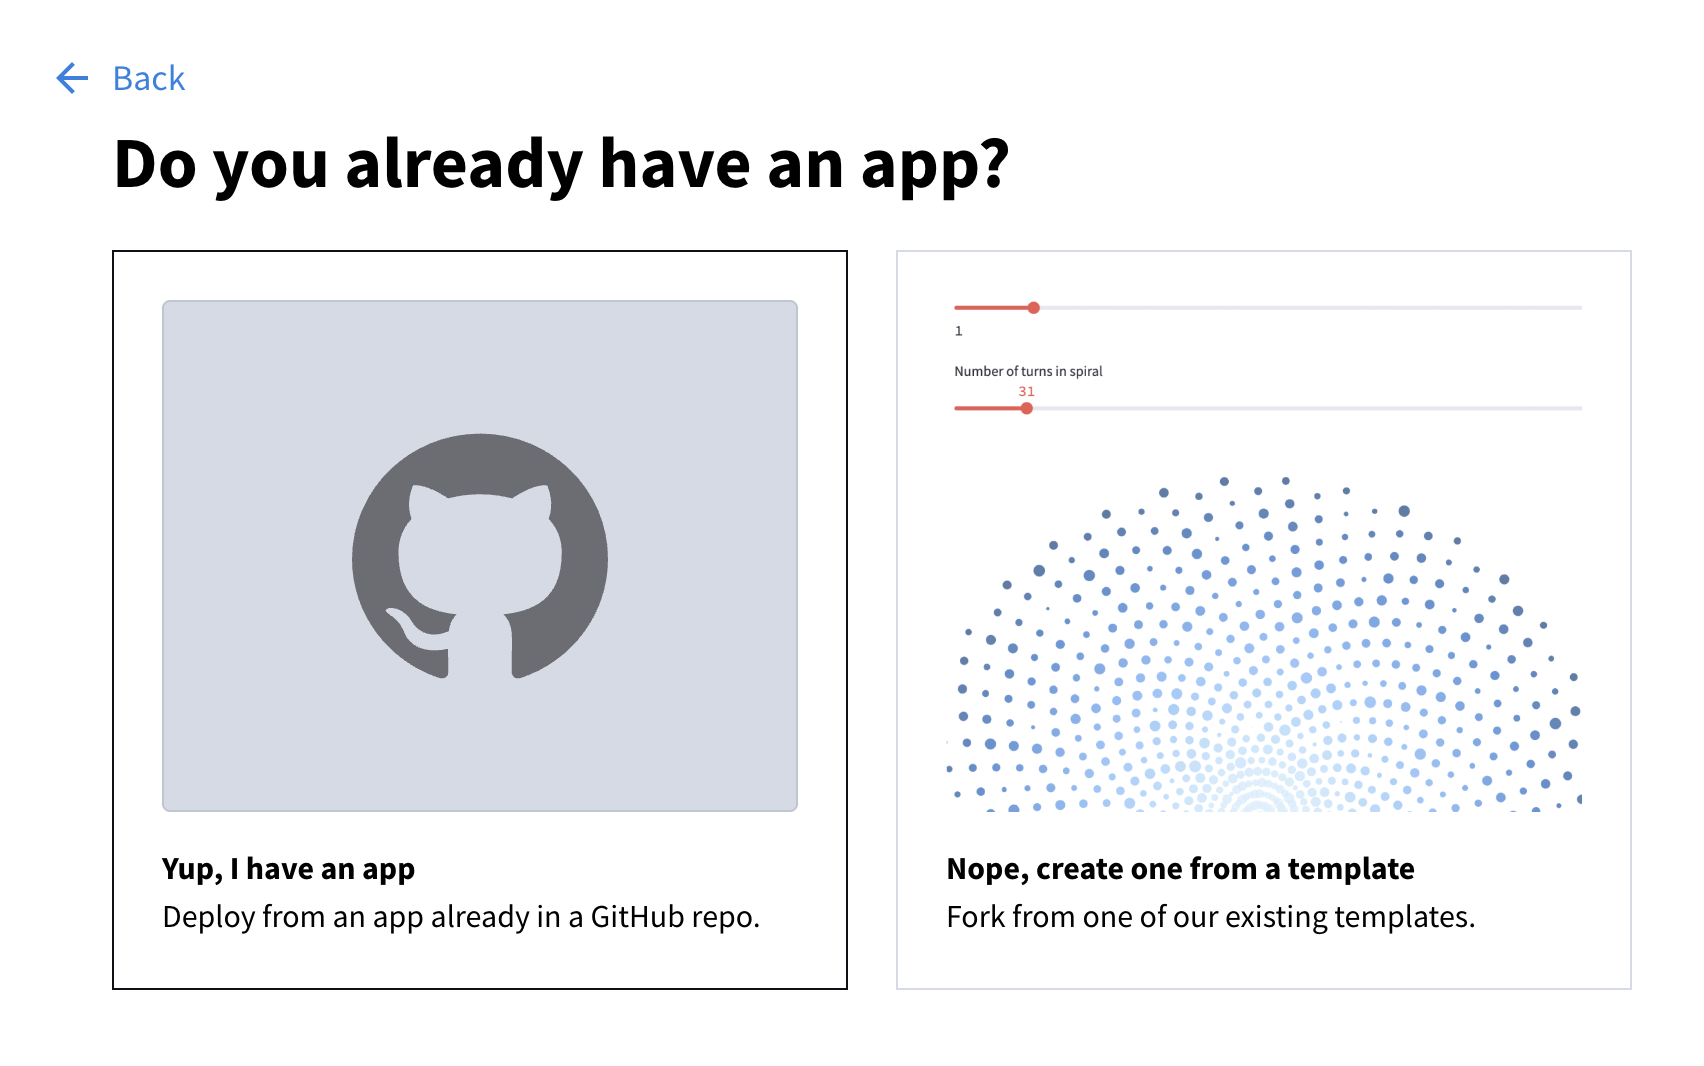
앱을 배포할 깃허브 레포와 브랜치, 메인 파일, URL(선택) 을 지정해준다.
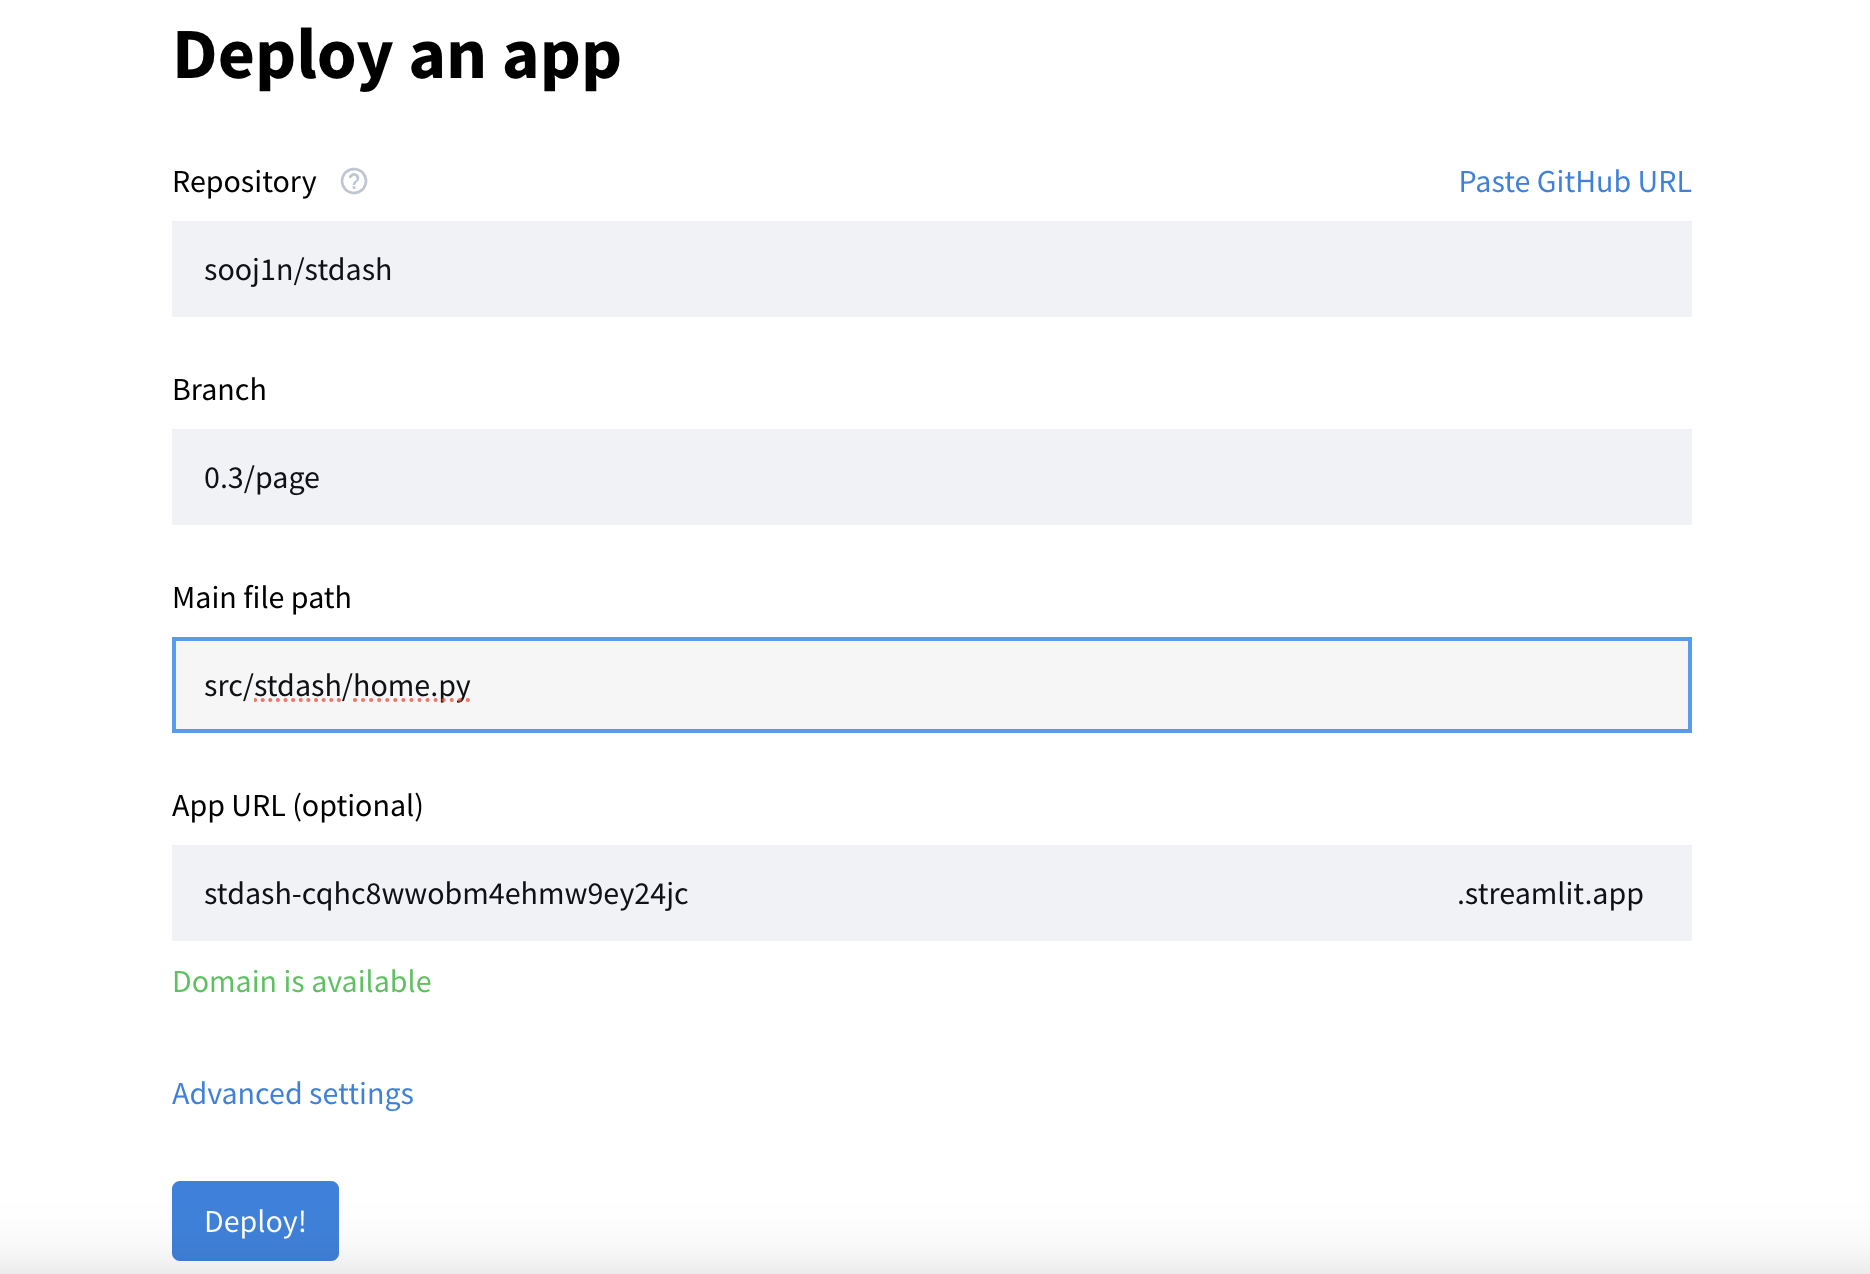
귀여운 화면과 함께 배포가 된다
오븐이라닛 ~~ 귀엽다

근데 오류가 발생했다. 찾아보니 의존성 관리 도구와 관련된 오류가 발생했다는 것 이었다 !
앱이 실행되려면 이 프로젝트 같은 경우는 streamlit과 matplotlib가 자동으로 설치되어야하는데 그 설정이 누락된 것 이었다.
[     UTC     ] Logs for stdash-2h2jakhguhe3d38gdvcupn.streamlit.app/

────────────────────────────────────────────────────────────────────────────────────────

[05:48:34] 🚀 Starting up repository: 'stdash', branch: '0.3/page', main module: 'src/stdash/home.py'

[05:48:34] 🐙 Cloning repository...

[05:48:35] 🐙 Cloning into '/mount/src/stdash'...

[05:48:35] 🐙 Cloned repository!

[05:48:35] 🐙 Pulling code changes from Github...

[05:48:35] 📦 Processing dependencies...


─────────────────────────────────────── poetry ─────────────────────────────────────────


/mount/src/stdash /mount/src/stdash


[tool.poetry] section not found in /mount/src/stdash/pyproject.toml

/mount/src/stdash


────────────────────────────────────────────────────────────────────────────────────────


[05:48:37] ❗️ installer returned a non-zero exit code

[05:48:37] ❗️ Error during processing dependencies! Please fix the error and push an update, or try restarting the app.

[05:50:14] ❗️ Streamlit server consistently failed status checks

[05:50:14] ❗️ Please fix the errors, push an update to the git repo, or reboot the app.
해결 방법으로 2 가지가 있는데 나는 requirment 파일을 생성하는 방법으로 해결했다.
메인 파이썬 파일이 있는 위치에 아래의 파일을 작성해준다.
의존성 문제가 해결 될 것이다.
$ cat src/stdash/requirements.txt
streamlit>=1.38.0"
matplotlib>=3.9.2"
https://stdash-2h2jakhguhe3d38gdvcupn.streamlit.app/
home
This app was built in Streamlit! Check it out and visit https://streamlit.io for more awesome community apps. 🎈
stdash-2h2jakhguhe3d38gdvcupn.streamlit.app
5. Docker
이제 . 이프로그램을 도커로 빌드해보겠다.
도커가 젤 떨린다 !!!! ㄷㄷㄷ
먼저 Dockerfile
img는 홈 화면이 허전해서 사진을 넣기위해
디렉토리 COPY하는 법을 알게 되었다. img, pages 참조
그리고 CMD에서 스트림릿을 실행시켰고 여기서 포트 8000인것을 기억해야한다.
FROM python:3.11

WORKDIR /code

COPY /src/stdash/home.py /code
COPY img /code/img
COPY /src/stdash/pages /code/pages

RUN pip install --no-cache-dir --upgrade git+https://github.com/sooj1n/stdash.git@0.4/dockerizing

CMD ["streamlit", "run", "home.py", "--server.port=8000", "--server.address=0.0.0.0"]
아래와 같이 도커를 빌드하고 실행시켰다.
도커파일에서 포트를 8000으로 설정했으니까 아무포트:8000으로 해야한다.
도커 자체는 8000포트에서 수행되는거고 그 내부 포트가 여기서는 8123인거다.
그래서 localhost:8123으로 접속하면 스트림릿 앱이 수행되는 것을 확인할 수 있을 것 이다.
$ docker build -t stdash:0.1.0 .
$ docker run -d -p 8123:8000 --name s1 stdash:0.1.0
끝@@
오늘의 실습
완벽했다
비! 빔!
'playdata > daily' 카테고리의 다른 글
| 17주차 : Day 1 (10/28) (2) | 2024.10.28 |
|---|---|
| 16주차 : Day 1 (10/21) (1) | 2024.10.21 |
| 12주차 : Day 4 (9/26) (0) | 2024.09.30 |
| 12주차 : Day 3 (9/25) (1) | 2024.09.30 |
| 12주차 : Day 2 (9/24) (0) | 2024.09.30 |